Nobody (really) changes
Counting the number of people who change.
In my American Sociological Review paper with Steve Vaisey (open access version here), we look for evidence that people make persisting changes in attitudes and behaviors in the General Social Survey. We present one approach to measuring persistence in the paper, but we tested many approaches throughout the project. Over the next couple weeks I want go through some of the approaches we tried. And I’ll show how different approaches all produce the same result we find in the paper: persisting change in any kind of attitude is extremely rare in American adults.
Our paper argues that, at the individual level, people follow one of two models of attitude formation: a settled dispositions model, in which changes are temporary and people revert to their baseline, and an active updating model, in which changes persist.
A challenge of comparing these models is that in a three-wave survey context, both models can produce individuals who look like they are making persistent changes. For a simple example, consider one of the seven GSS questions about conditions under which people support legal access to abortion: “Please tell me whether or not you think it should be possible for a pregnant woman to obtain a legal abortion if the woman wants it for any reason.” Respondents could select “yes” or “no” as responses.
Under the active updating model, a person who changed from saying “yes” at wave 1 to “no” at wave 2 should say “no” again at wave 3. Under the settled dispositions model, we should view it as equally likely that wave 1 or wave 2 is a temporary departure from the person’s baseline. The patterns “no-yes-yes” and “yes-no-yes” (and “yes-yes-no”) should be equally common because these deviations (the nos) are random. If “no-yes-yes” occurs as often as “yes-no-yes”, then the former does not provide any evidence of persistent change (or we have a hard time explaining the latter).
As a result, we should guess that 50 percent of the time people who give different responses at waves 1 and 2 would say “yes” at wave 3 and 50 percent of the time they say “no.” In other words, we see people who look to be persisting (“no-yes-yes”) simply because their wave 1 response was a temporary (or random) departure from their baseline.
Of the 2,297 people who responded to the abortion question over three waves, 424 (18 percent) gave different answers in waves 1 and 2. Under the settled dispositions model, in which deviations are equally likely in each wave, we would expect that 212 people would appear to be making persisting changes even when they are not, simply because of the three-wave structure.
What we see is that 227 people show a pattern of persistence, or just 15 more than expected if the settled dispositions model generated the data. That is not a lot of people. Those 15 percent of people account for less than 1 percent of the total sample. So already we can say that persisting change in this item is substantively rare.
Is that enough people to say that we see some evidence of persistence in the population? Would it be unusual to get that many people displaying evidence of persistence if there is no persistence in the population?
A simple calculation of confidence interval for the proportion of changers persisting, where we use the number of people who change (424) as the sample size, gives us a 95 percent confidence interval of [.487, .582], which includes 50 percent, meaning it is quite plausible that we get this value even if nobody is making any persistent change in the population.
The figure below shows estimates for the percent of the population giving different responses in the first two waves (“changing”), the percent of changers persisting, and, using those two values, the percent of the population making a persistent change, for the seven binary questions about abortion.1
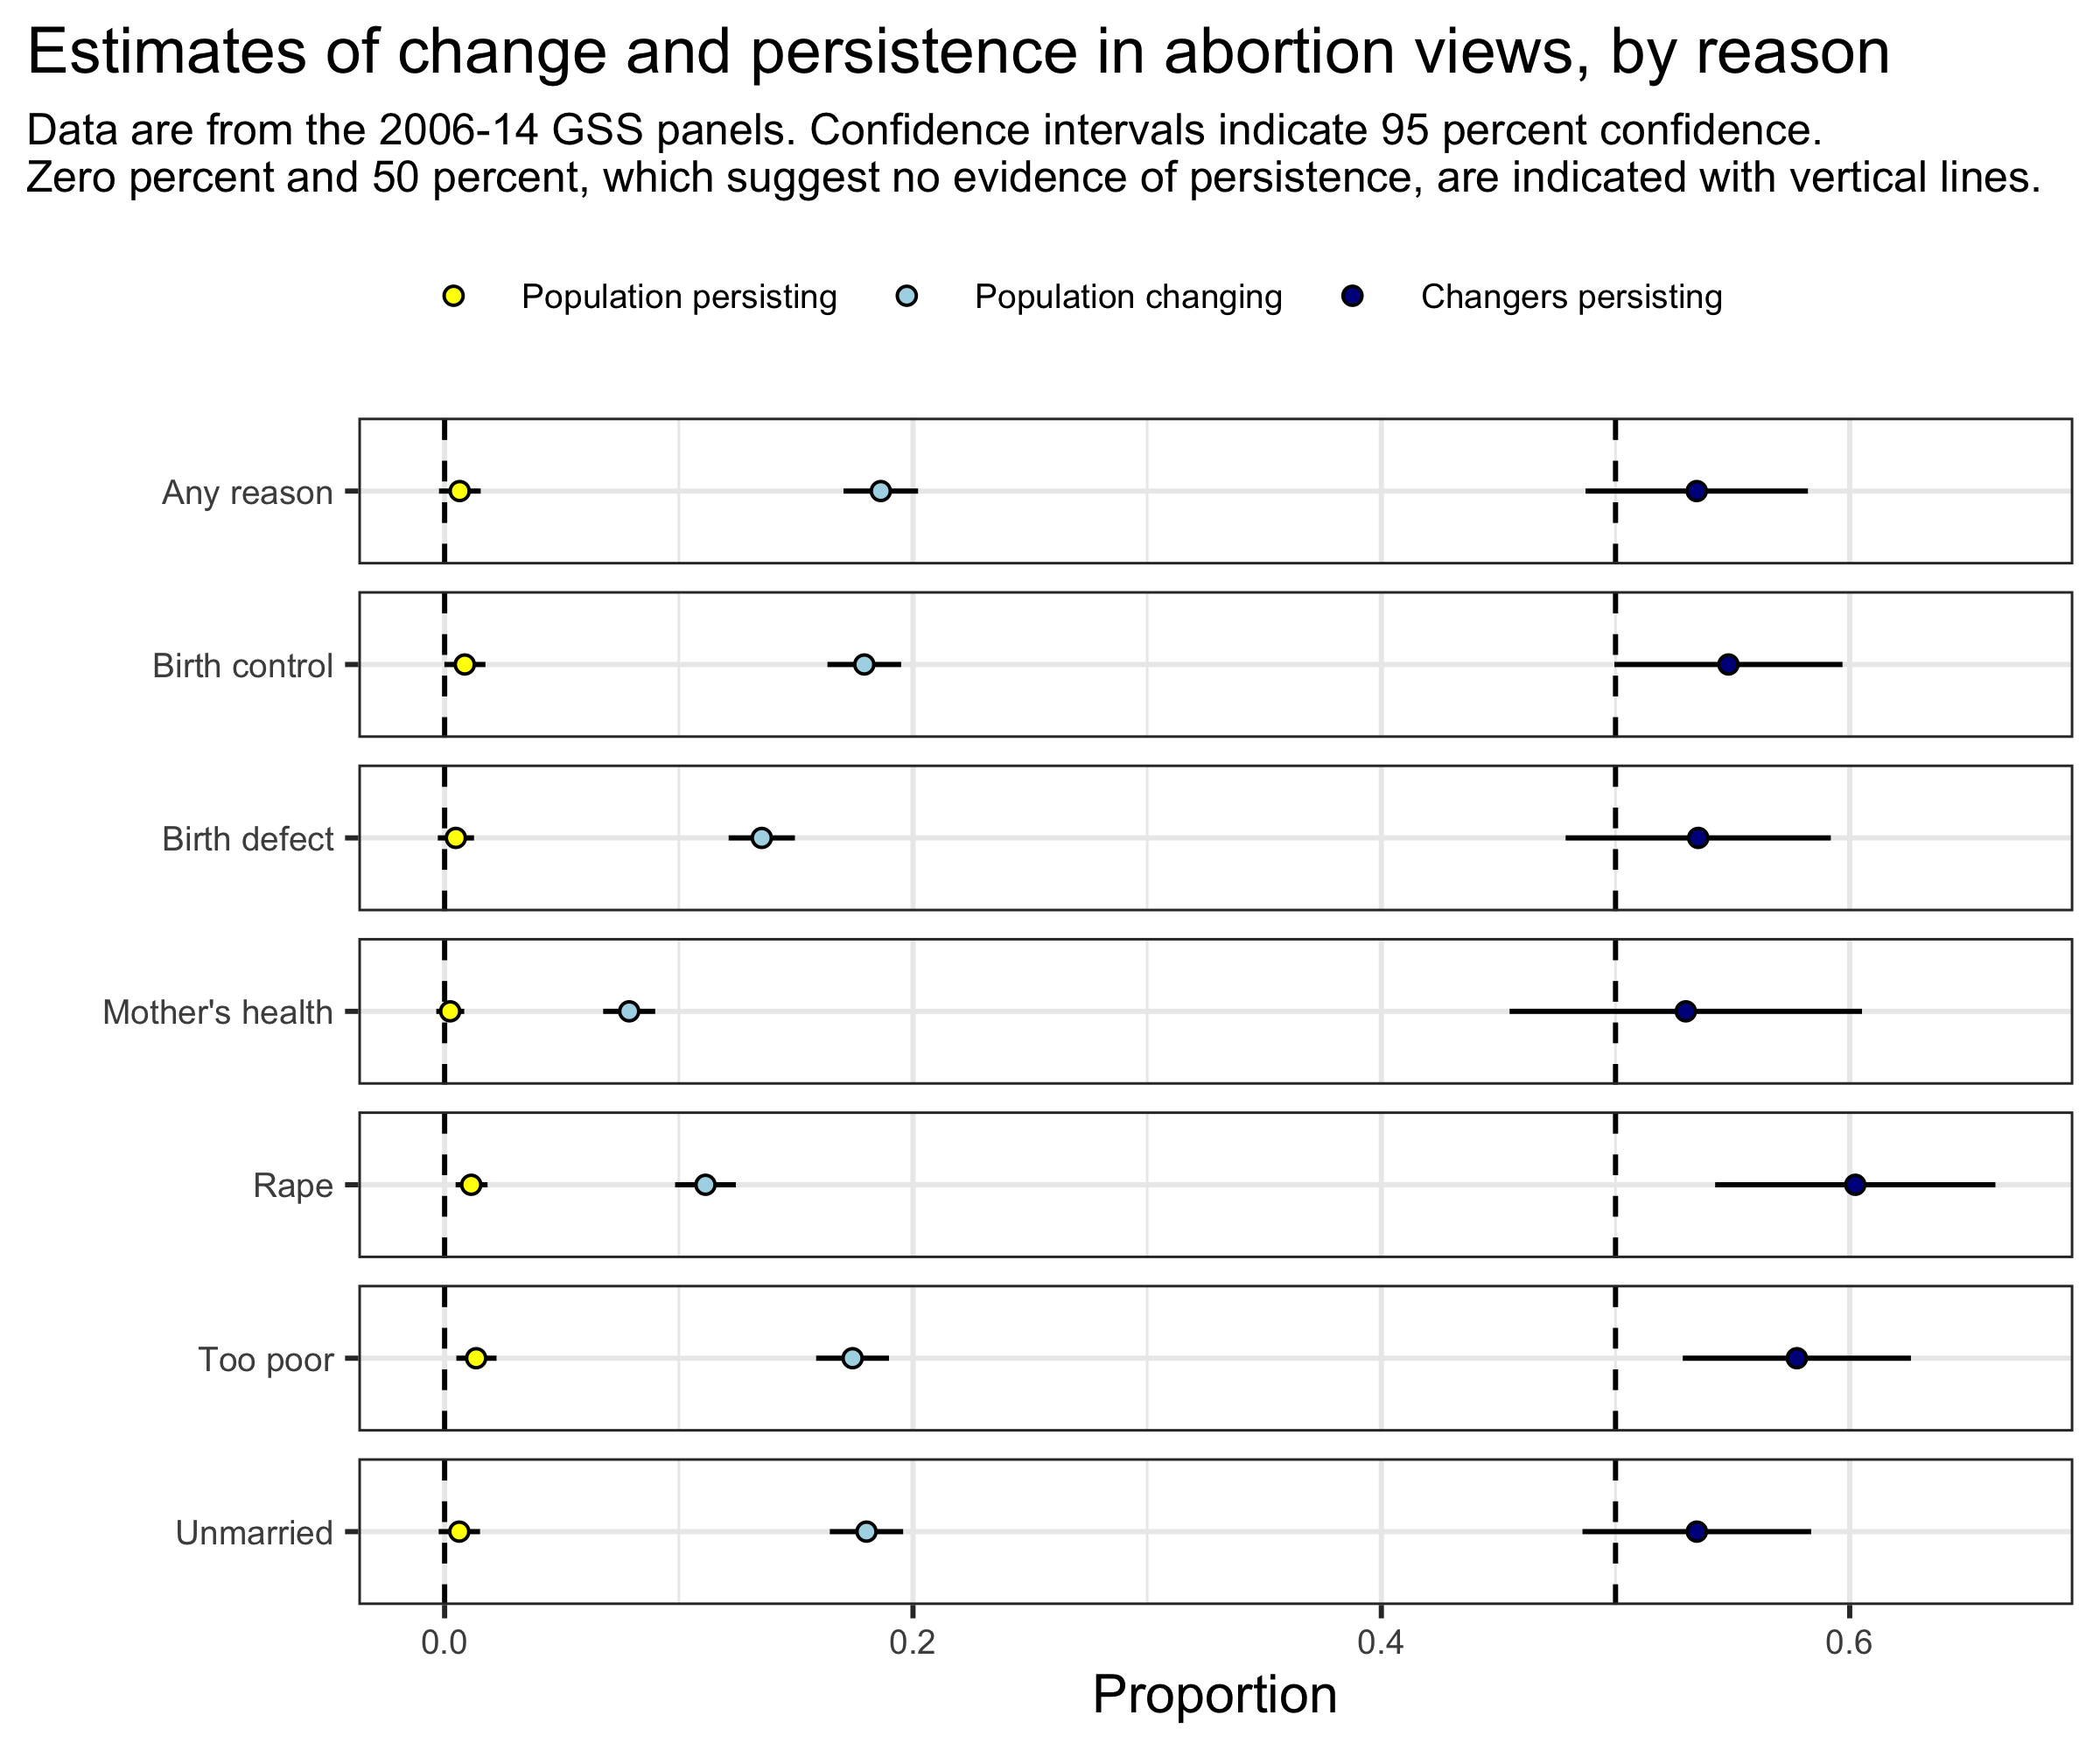
What should be obvious from the figure is that almost nobody makes a persistent change in any of these views on abortion in the GSS panels. There is only real evidence of persistence for the questions about abortion in the case of rape and if a woman is poor and cannot afford another child. For both questions, the best estimate is that one percent of the population makes a persistent change in a two-year period. This is the pattern thing we find in our paper using a different method.
This approach is easiest to justify with questions binary responses, where changes are always equal. Binary questions constitute about a third of GSS attitude questions and include questions about civil liberties, racial differences, laws, and suicide.
If we make the assumption that all one-unit changes in ordinal responses are equal, we can extend this approach to non-binary items. This might or might not be a viable assumption, depending on the question, which we can return to later. For the non-binary case, the question is not whether the respondent says the same thing in waves 2 and 3 more than chance, but rather whether, at wave 3, the respondent is closer to their response at wave 2 than wave 1.
The figure below considers seven questions about political views. It presents the same set of estimates for the proportion of the population giving different responses for waves 1 and 2, the proportion of “changers” who are closer to their wave 2 response than their wave 1 response at wave 3, and the estimated proportion of the population making a persisting change, based on those values. These quesitons all have between five and seven response options on an ordinal scale.
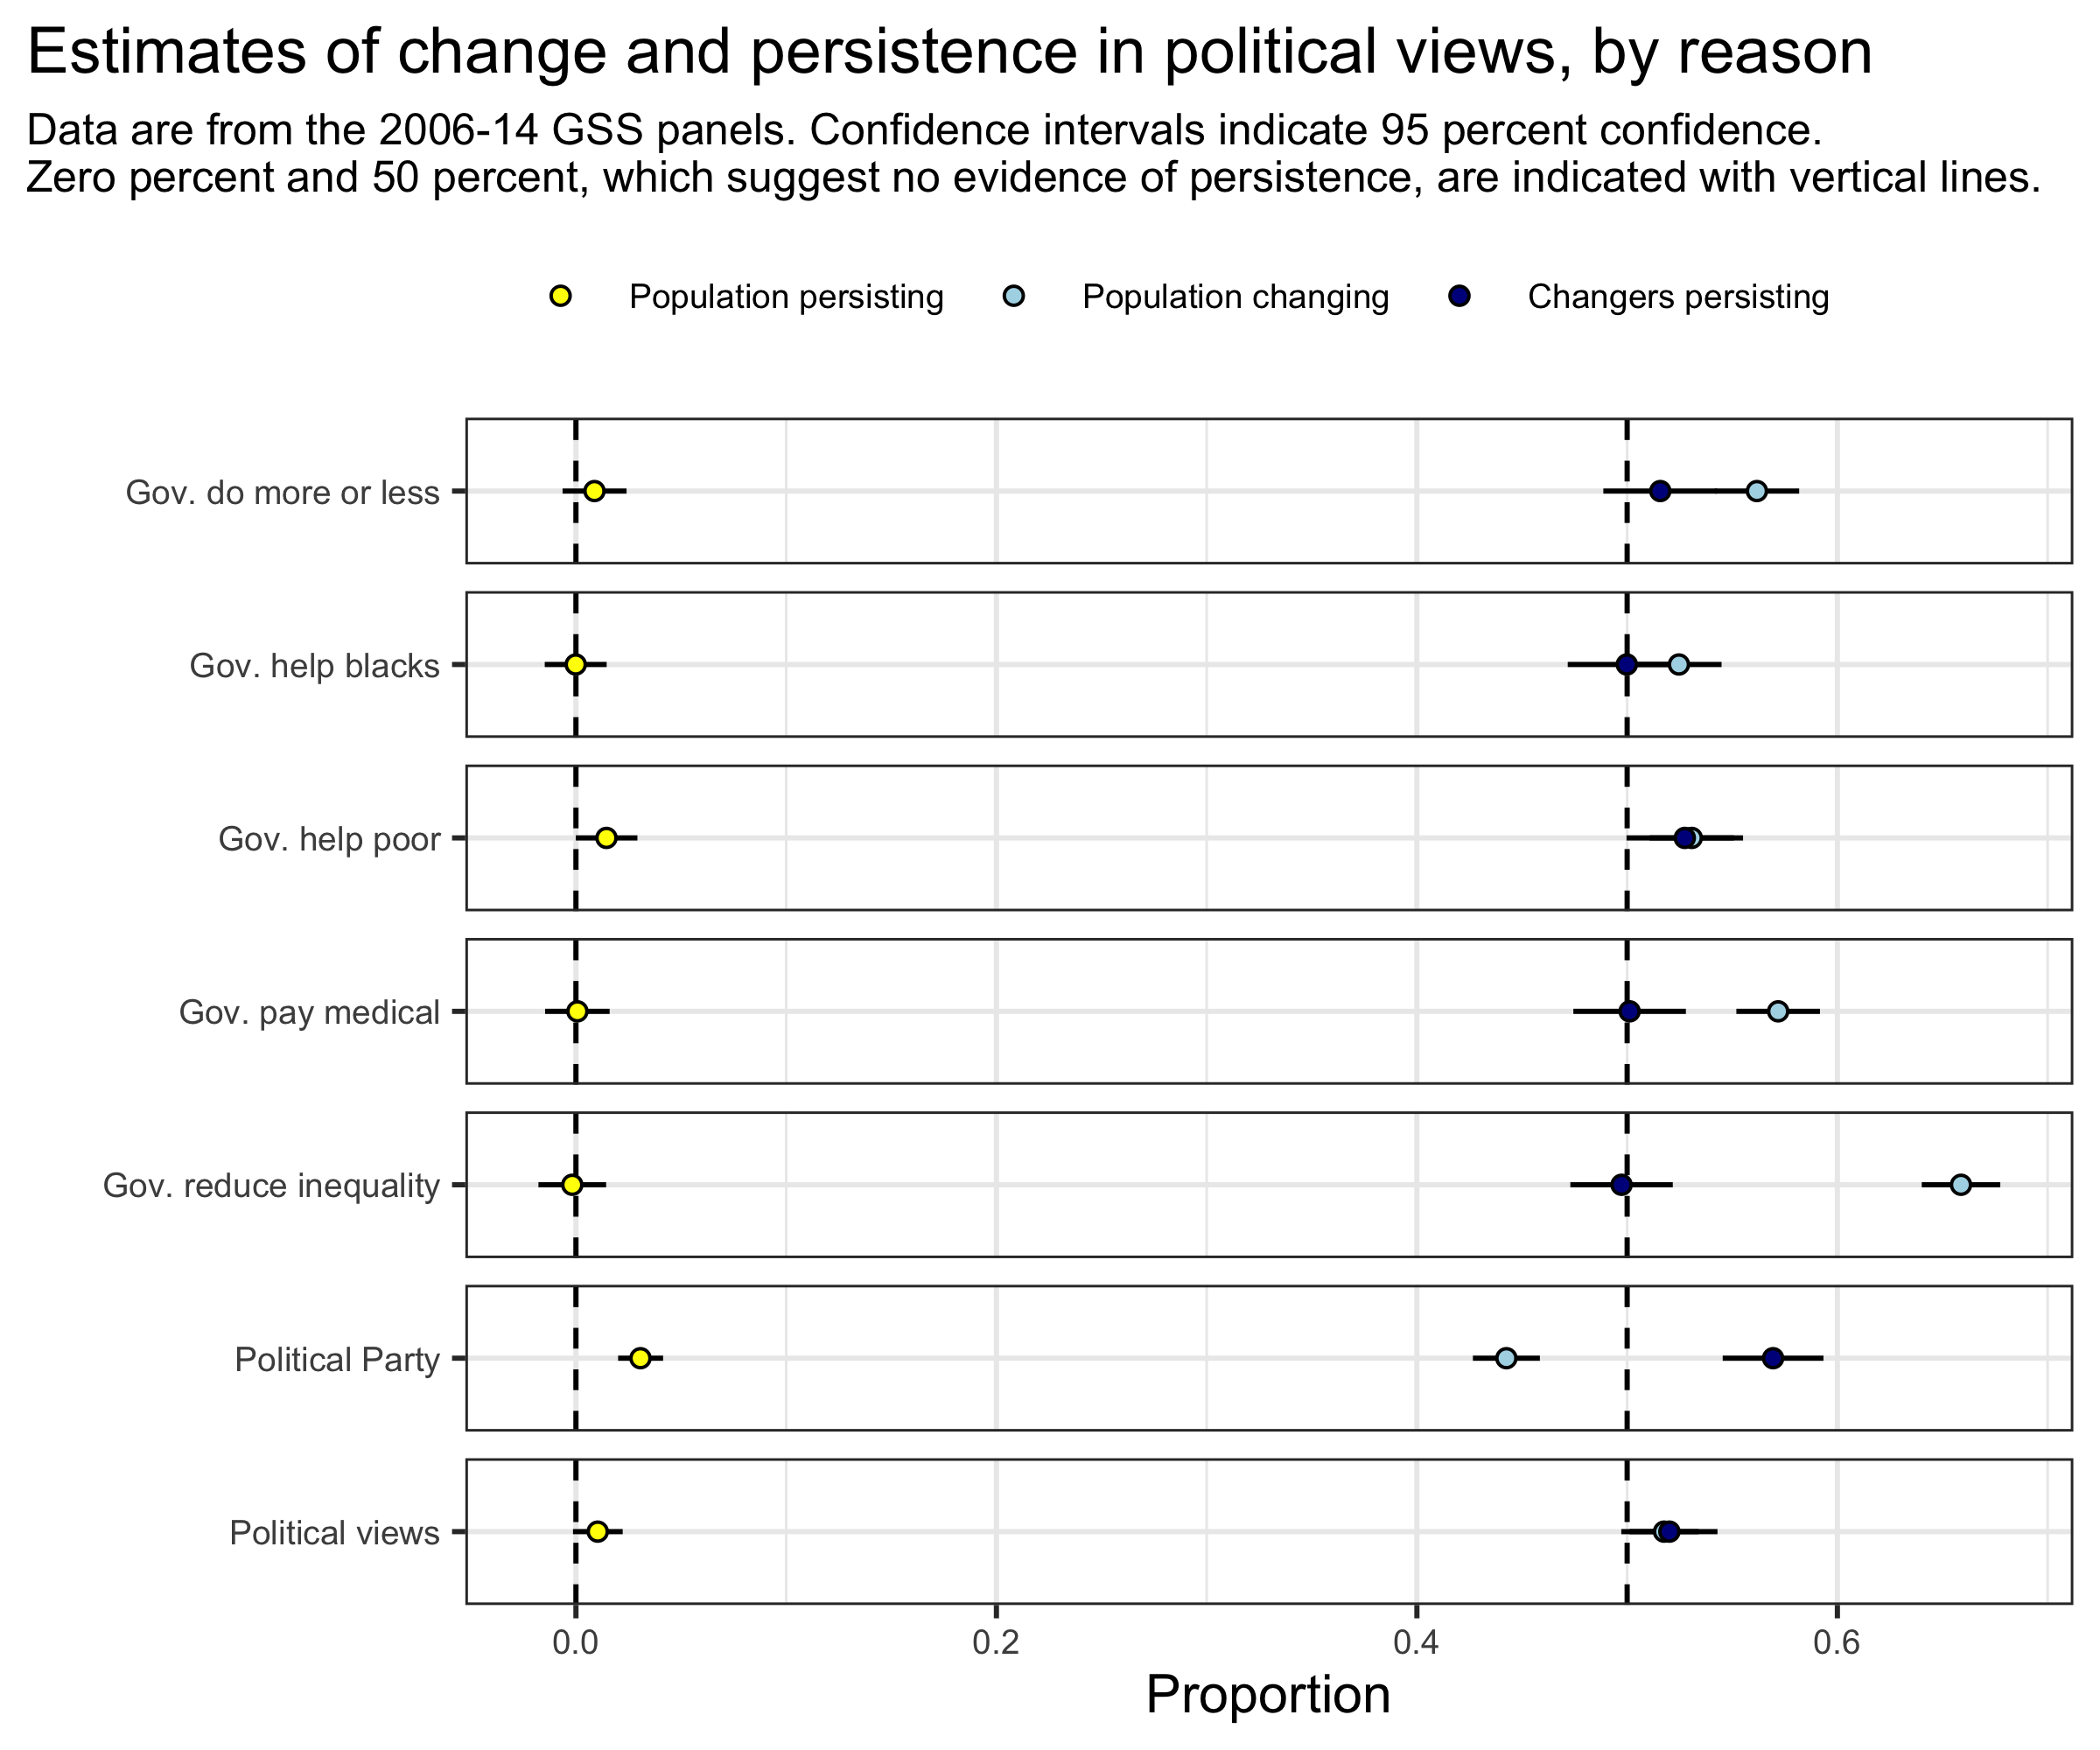
Again, we see that for many of these questions, people who give different reports at waves 1 and 2 are as likely to be closer to their wave 1 response as their wave 2 response, which suggests the “settled dispositions” model is the more likely data-generating process. Because the scales have more potential values, the proportion of people giving different responses at waves 1 and 2 are higher than in the binary case, but there’s no more evidence of persistence than in the binary questions.
Again, we reproduce one of the key findings of our paper: that there is very little evidence that American adults make persisting changes in their political views. Similar to the paper, there is some evidence that a small proportion of people change their political views.
If you’re not willing to make the assumption that all one-unit changes in an ordinal scale are the same, we can collapse categories to measure more substantive changes. But I’m going to argue that you’re wasting your time. We can cut up the seven-point political views question in a number of ways, but I’ll feature three substantively interesting ones here:
- Seven separate values: Extremely Liberal, Liberal, Slightly Liberal, Moderate, Slightly Conservative, Conservative, Extremely Conservative
- Liberal/moderate/conservative: (Extremely Liberal, Liberal, Slightly Liberal), (Moderate), (Slightly Conservative, Conservative, Extremely Conservative)
- Clustering in middle: (Extremely Liberal, Liberal), (Slightly Liberal, Moderate, Slightly Conservative), (Conservative, Extremely Conservative)
Below I plot these three approaches to the political views question.
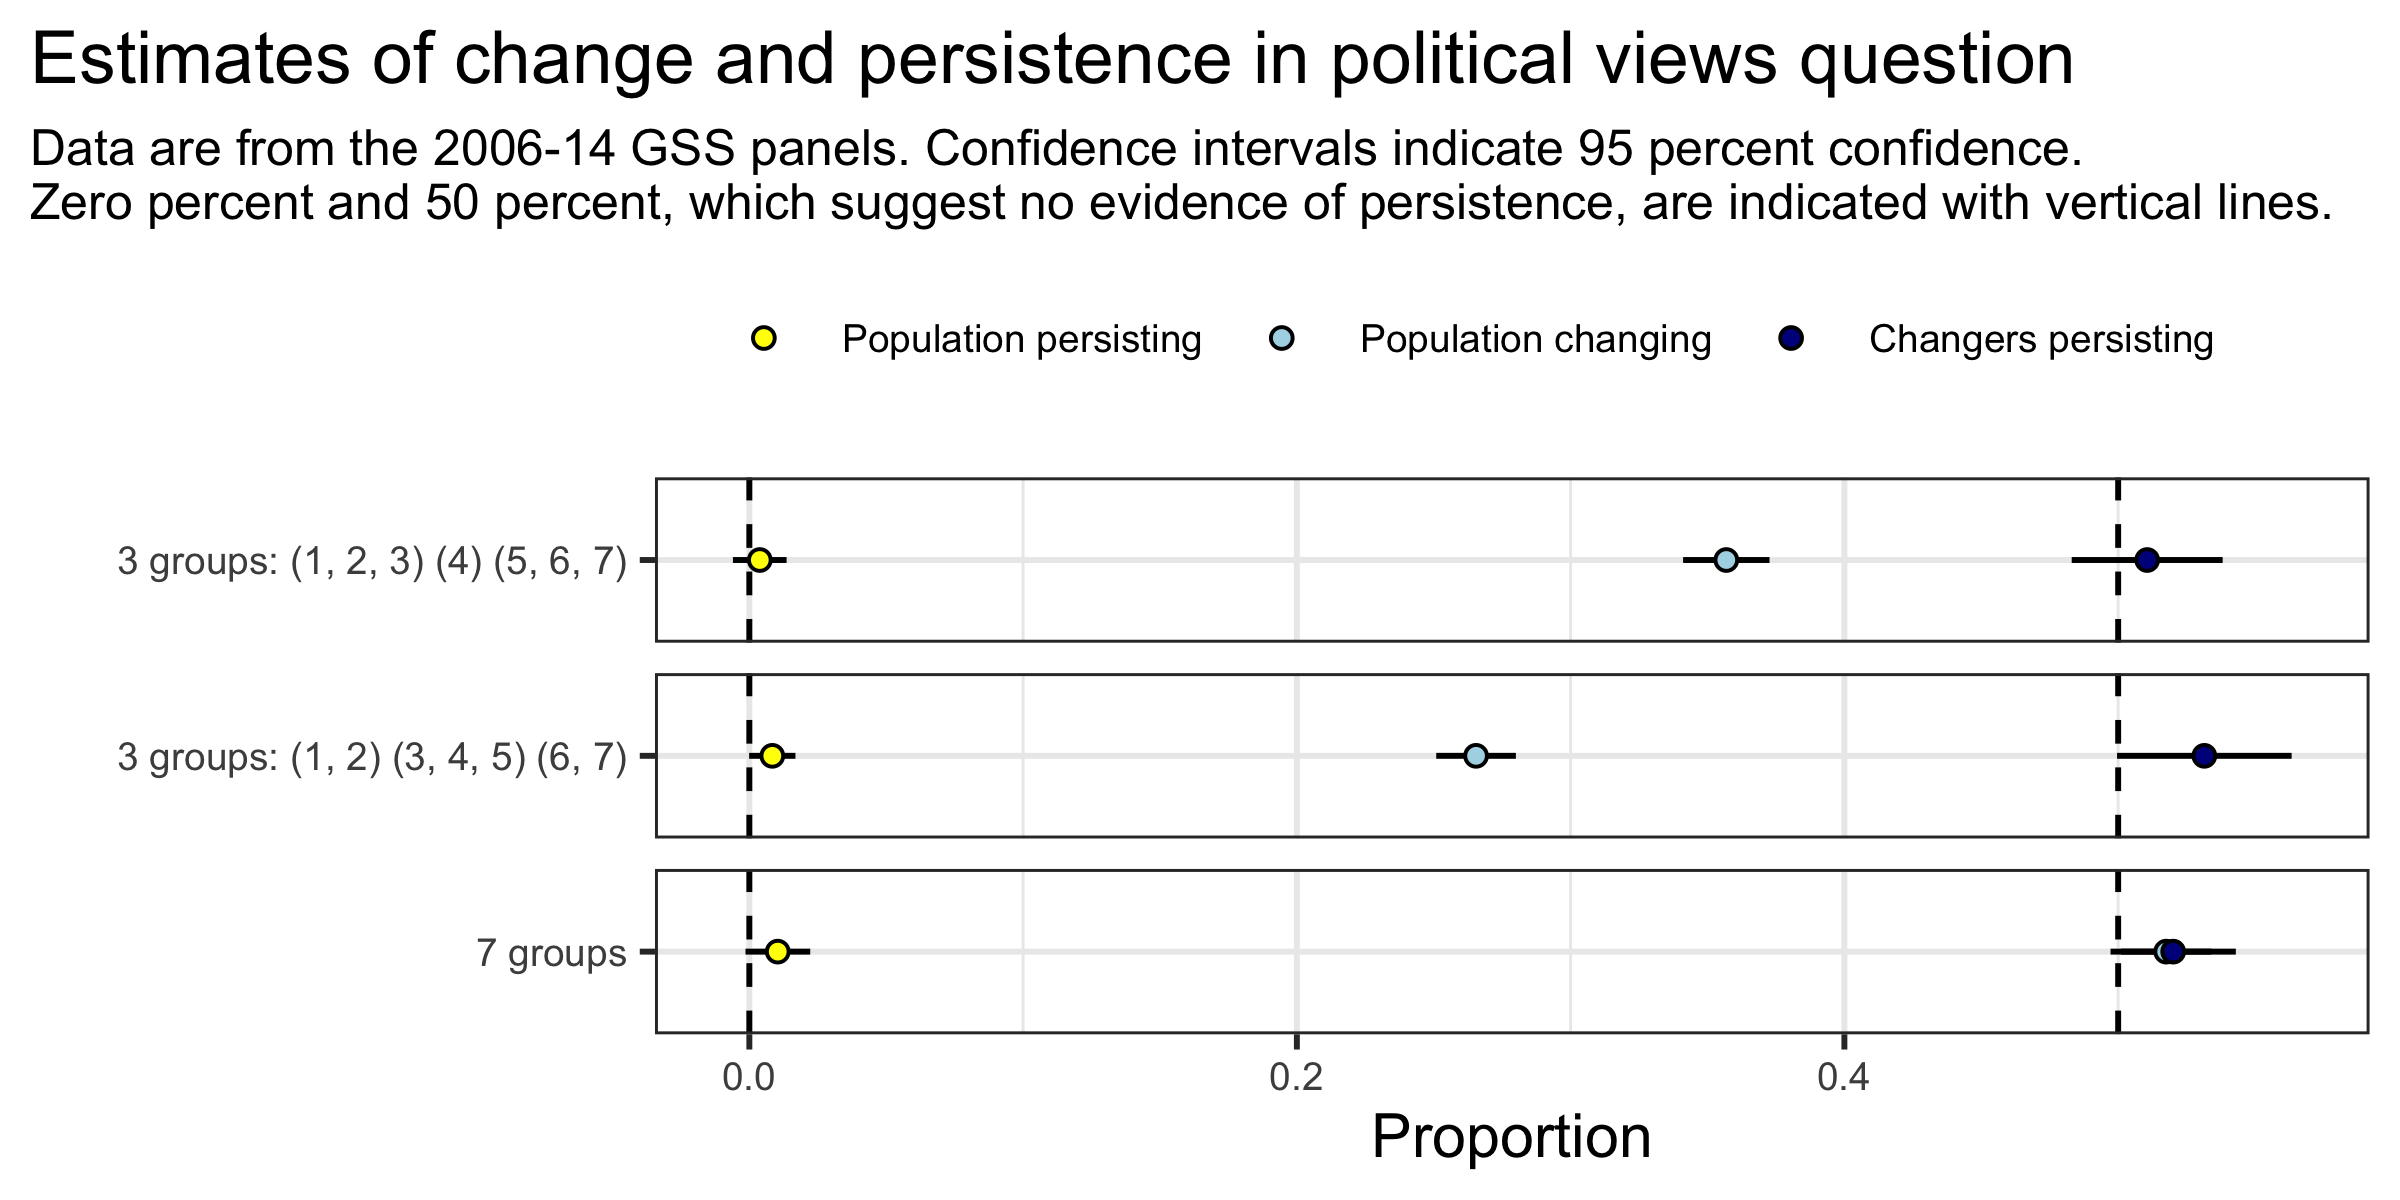
This approach shows us that grouping does not seem to affect our estimates of persistence for this question. Grouping in different ways decreases the amount of change in the population (since we are not capturing within-group changes), but does not affect our overall estimate of persistence in any substantial way. A structure that groups the three middle categories seems to provide the most evidence of persistence (though still not statistically significant at the alpha = .05 level), which is consistent with work that suggests that people who do not have clear views tend to select around the middle. Even then, the actual rate is very small.
I’ve created a shiny app where you can check out these estimates for every GSS question we explore in our paper, in which you can also compare by age group and panel. These results are remarkably consitent with what we see in the paper: change is very rare (often indistinguishable from 0) for views on gender, race, politics, law enforcement, religious beliefs, sex, and social trust. Categories that do show evidence for persistent change include confidence in institutional leadership and individual health and morale, but even these items show rates of less than five percent.
The takeaway, just like the paper, is that persistent change in U.S. adults is exceedingly rare.
-
Several items in this and successive figures indicate a point estimate or confidence interval that suggests a negative proportion of persistence. This is conceptually problematic, but included for ease of presentation. These should be interpreted as reflecting no evidence of persistence. An item where the point estimate and confidence interval for the proportion of people persisting are entirely under 0 should be interpreted as indicating that people who change their response between waves 1 and 2 are more likely to be closer to their wave 1 response than their wave 2 response at wave 3. ↩︎
Kevin Kiley
Assistant Professor
I’m a sociologist exploring the origins of cultural and political beliefs, attitudes, and preferences. And I play with data.